Contoso is a global retail company operating across multiple countries and product categories. Revenue grew from $88M in 2015 to $444M in 2022 before declining, raising concerns around customer retention and revenue concentration. Leadership suspects that revenue may be heavily dependent on a relatively small group of high-value customers, creating potential exposure if these customers reduce engagement or churn.
The Challenge: Assess dependency on high-value customers, identify early disengagement signals, and quantify revenue exposed to potential churn.
Contoso faces a significant revenue concentration risk, with 43.5% of total revenue generated by its top 20% of customers. This analysis identified $78.7M in revenue and $44.2M in profit at risk from declining high-value customers, with exposure concentrated in the Online channel and a small number of physical stores. The findings show that revenue risk is driven by weakening engagement among high-value customers rather than being evenly distributed across the customer base. Strengthening retention efforts for declining customers, high-risk channels, and priority stores is therefore likely to deliver the greatest business impact.
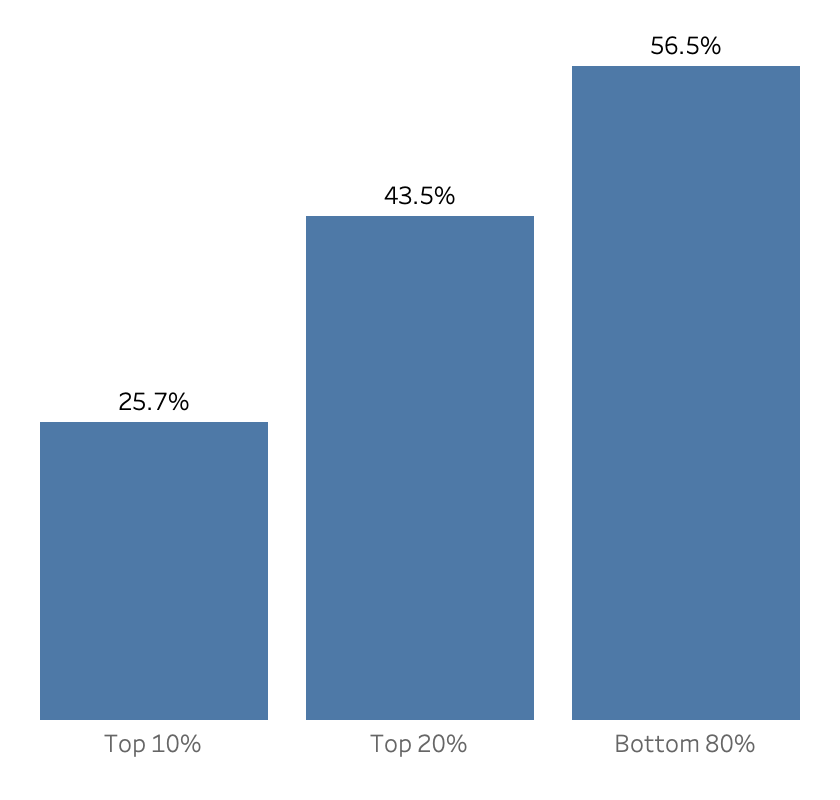
The top 20% of customers contribute 43.5% of total revenue and 44.26% of total profit. Within that group, the top 10% alone account for more than a quarter of both revenue and profit. This level of concentration increases the business's exposure if high-value customers reduce spending or churn.
Only 26% of high-value customers show consistent engagement, while 49% are classified as Inactive. The Declining segment (1,421 customers) shows the largest recency gap at ~558 days despite historically healthy purchase frequency. This suggests that revenue risk is emerging before customers are fully lost, creating an opportunity for targeted retention efforts.
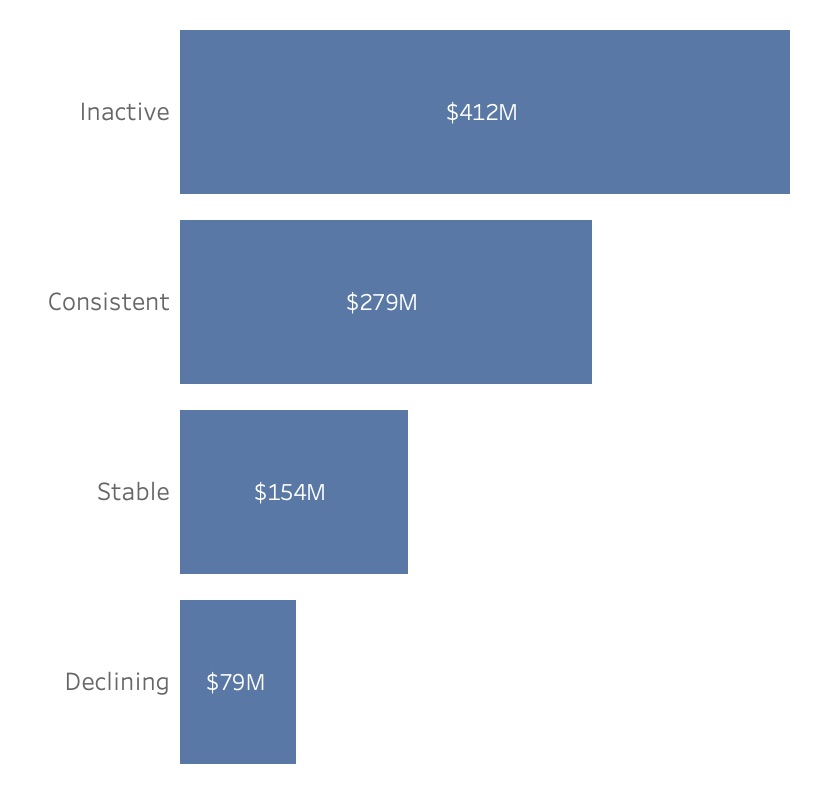
The Declining segment contributes $78.7M in revenue and $44.2M in profit, representing the largest recoverable opportunity among high-value customers. In contrast, Inactive customers account for $411M in historical revenue, indicating a substantial portion has already been lost. Prioritizing this segment offers the greatest opportunity to protect revenue before customers become inactive.
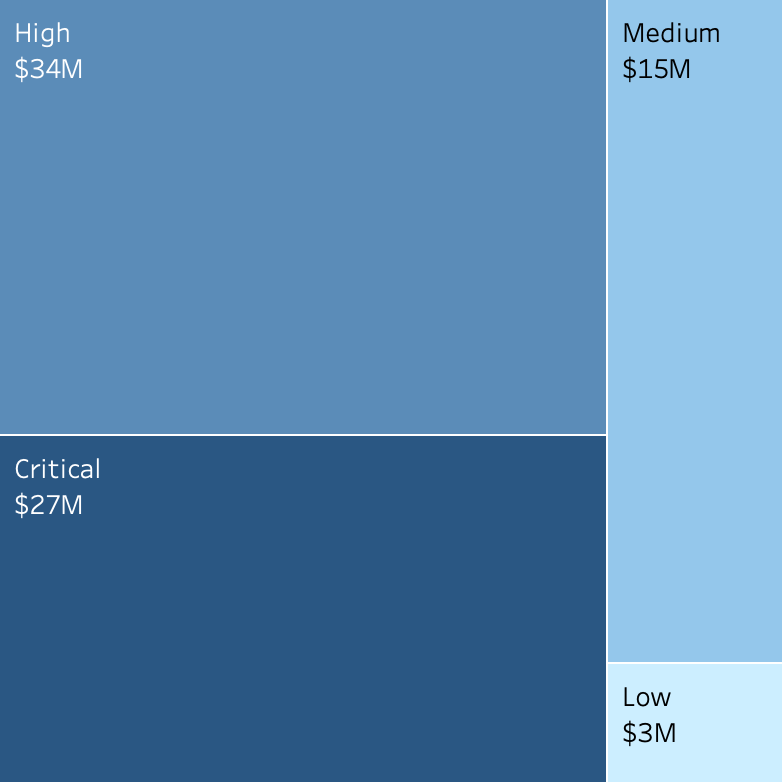
The Online channel holds $27.1M at risk across 1,420 declining customers, representing 34% of total at-risk revenue. Eighteen high-risk physical stores contribute an additional $34M, but the exposure is distributed across locations rather than concentrated in a single channel. Targeting the Online channel and high-risk stores is likely to produce a greater impact than broad company-wide retention initiatives
Target Segment: 1,421 Declining customers ($78.7M revenue at risk)
Target Area: Online channel ($27.1M at-risk revenue)
Target Area: 18 high-risk stores ($34M at-risk revenue)
Target Area: Customer concentration risk